Field Notes from the Carbon and Optics Lab: The Wisconsin Tour
By Emily Hyland | Graduate student (MS)
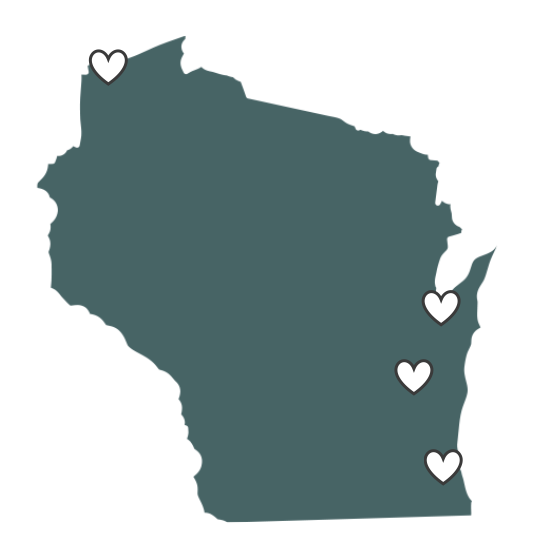
A big part of what we do in the Carbon and Optics lab happens outside the lab out on the water. Since our focus is on the Great Lakes, we aim to sample at least one of them every month. In August 2025, Kendra, Trevor, and I packed up our gear for what I like to call the “Wisconsin Tour”. This was a whirlwind trip that took us to four very different lakes as part of our Plankton, Aerosol, Cloud, and ocean Ecosystem (PACE) project. Each stop gave us new challenges, surprises, and datasets along with a few chances to sneak in some adventure along the way!
Stop 1: Green Bay, WI
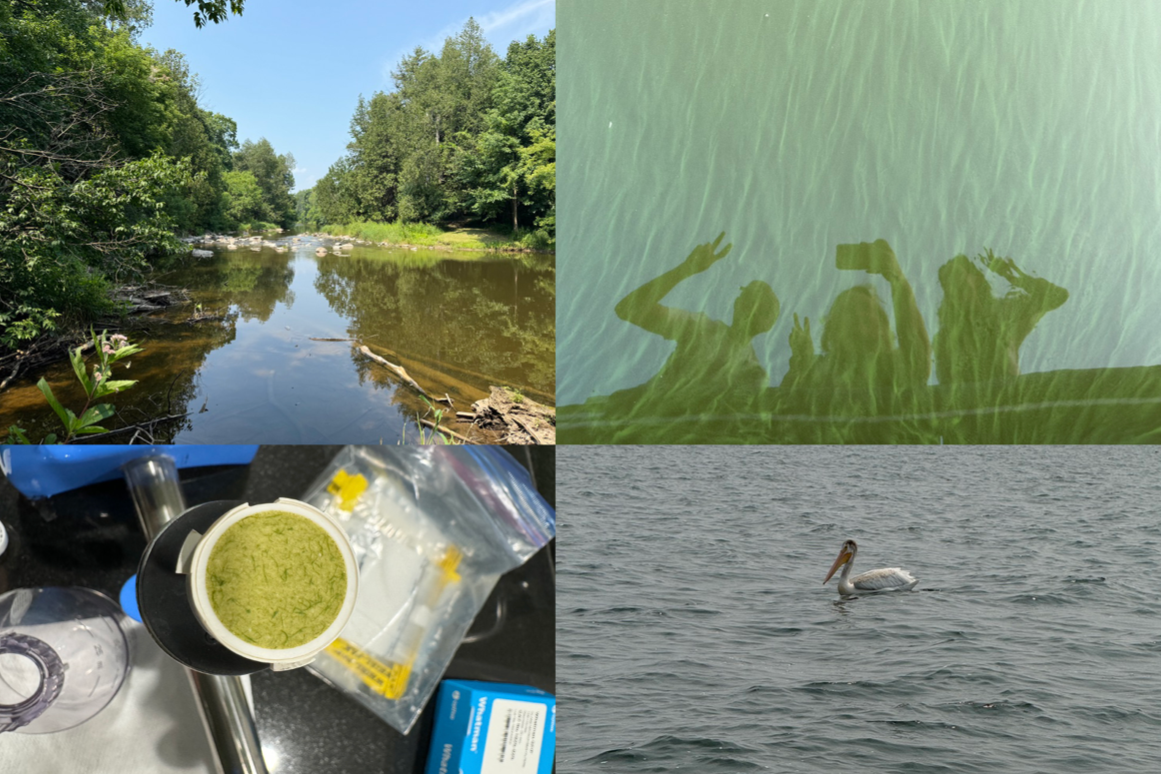
Our first stop was Green Bay, an arm of Lake Michigan that could not be more different from the main lake. Let’s just say Green Bay lives up to its name - the water is truly green! The photo in the top right captures the three of us reflecting off a patch of Microcystis, a cyanobacteria that forms harmful algal blooms. While no one wants to see Microcystis, it does provide us with a valuable dataset that captures a wide range of conditions. One of our samples (bottom left photo) was sent off for high-performance liquid chromatography (HPLC) to confirm exactly which phytoplankton pigments were present. Beyond the science, Green Bay gave us pelicans (bottom right photo) and an off-day hike at Cherney Maribel Caves County Park (top left photo). Field work trips are at the mercy of weather and satellite overpasses, so when conditions aren’t right, we trade the boat for trails!
Stop 2: Winnebago, WI
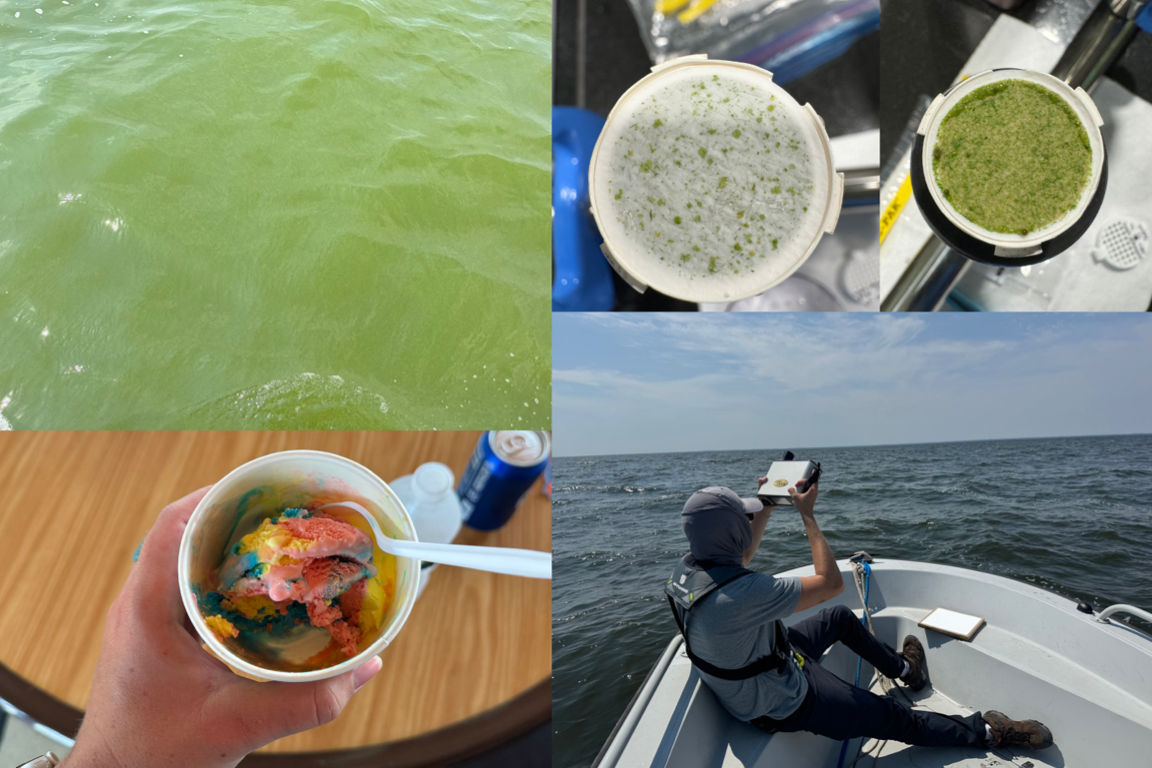
Next up: Lake Winnebago which was a brand-new site for us. Winnebago is a shallow freshwater lake, and it might just out-green Green Bay. The top left photo says it all. We collected water samples (top right) and Trevor is measuring remote sensing reflectance (Rrs) with our SVC instrument (bottom right). Rrs is the light that reflects off the water’s surface and back into the atmosphere. This is exactly what satellites like PACE measure. By pairing field measurements with satellite data, we can ground-truth what the satellite sees from orbit. This day was hot, over 80 °F, so finding Superman ice cream at the dock store was the perfect reward after hours on the water (bottom left). Sadly, we didn’t have time for exploring, but the ice cream made up for it.
Stop 3: Superior, WI
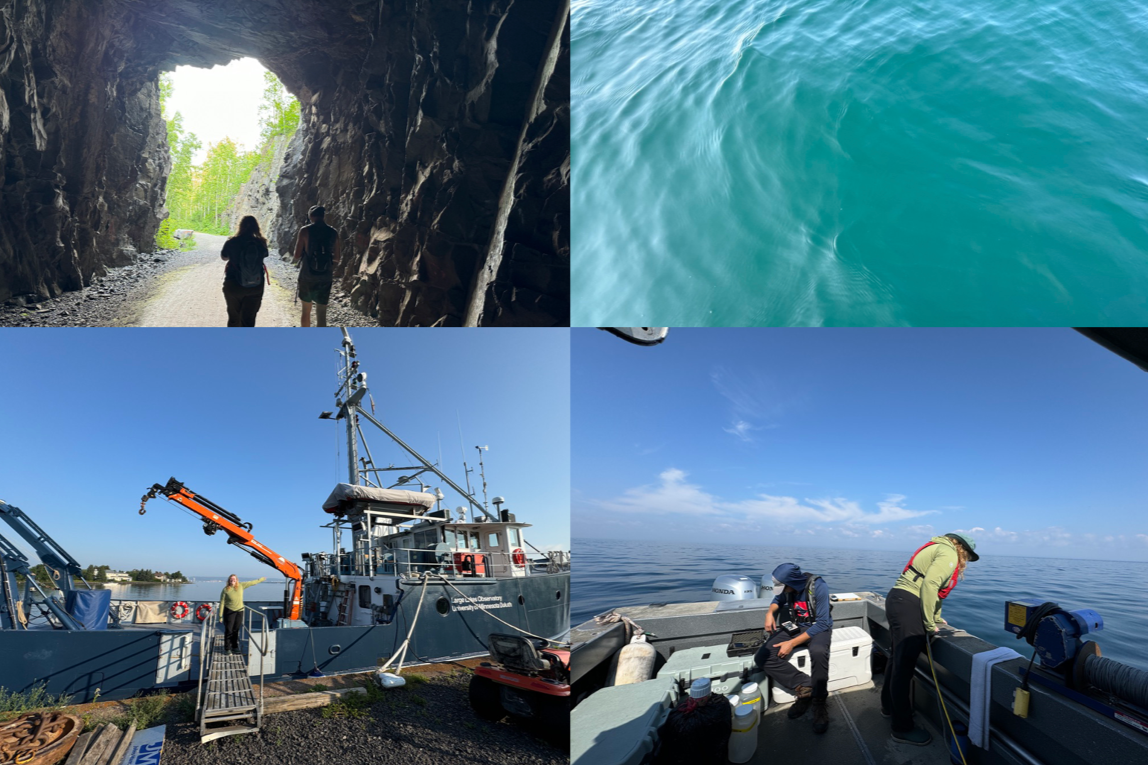
From green to crystal clear. Our third stop was Lake Superior, the largest and deepest of the Great Lakes. After days of turbid, bloom-filled waters, Lake Superior felt like stepping into another world! The top right photo shows just how blue the water was. The weather was perfect we had no waves, no wind, and plenty of sun. Perfect opportunity for Kendra to run a depth profile with our optical instruments and Trevor to set up another instrument (bottom right photo). Superior also gave us a nice look at the R/V Blue Heron, the University of Minnesota-Duluth’s Large Lake Observatory research vessel (bottom left photo). For fun, we hiked Ely’s Peak Trail and stumbled across a cave (top left photo). Between the science and the scenery, this stop was unforgettable!
Stop 4: Milwaukee, WI
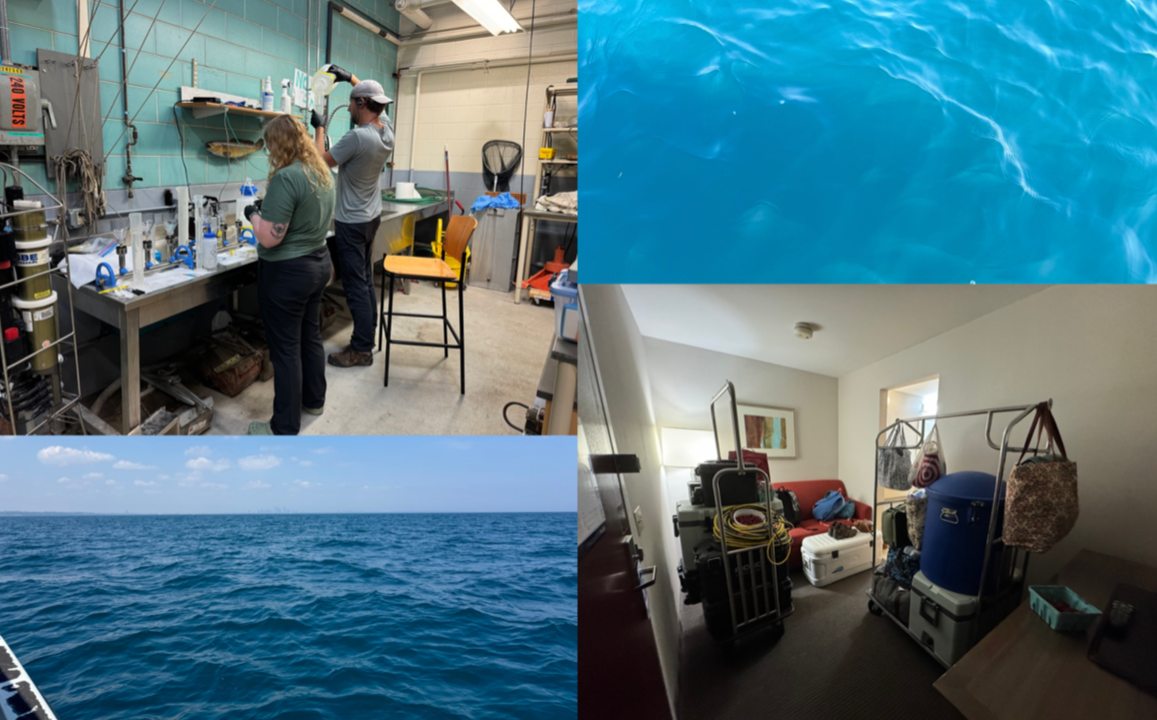
Our final stop was an unplanned one. While we were in Green Bay, Milwaukee was hit with severe flash flooding that dumped record-setting rainfall into the region. All that rainwater had to end up somewhere and much of it flowed straight into Lake Michigan. We decided to sample Lake Michigan near Milwaukee to see if we could detect any residual impacts of the flooding. The lake itself looked clear (top right and bottom left photos) but our filters told a different story with plenty of brown particulates. Top left photo is Kendra and Trevor filtering. Hopefully, this captured some of the flooding’s effects in our dataset. The only downside to Milwaukee was we had no time for exploring. Instead, we got an amusing reminder of just how much gear we haul around. The bottom right photo shows our hotel room filled wall-to-wall with equipment.
Conclusion
The Wisconsin Tour had its high (perfect weather on Lake Superior and ice cream in Winnebago) and its lows (heat, floods, and lots of gear wrangling) but the science made it all worthwhile. Each lake added a new layer of complexity to our dataset and gave us fresh insights into how these diverse systems behave. Four lakes. One state. Countless water samples, instrument casts, and memories. That’s fieldwork in the Carbon and Optics Lab!